This portfolio is a selection of projects exploring spatial analysis, cartography, and data visualization, ranging from conservation and environmental work to more exploratory and experimental mapping.
While the subjects vary, each project is driven by the same goals: clarity, thoughtful design, and effective communication of spatial ideas.
If you’re not quite sure what you’re looking for yet, this is meant to be a place to wander – to browse, get ideas, and see what’s possible when data and geography are allowed to speak for themselves. Everything shown here is copyright-free, and I’m always happy to share high-resolution outputs or source files where available. If something catches your interest, feel free to reach out and ask what’s under the hood.
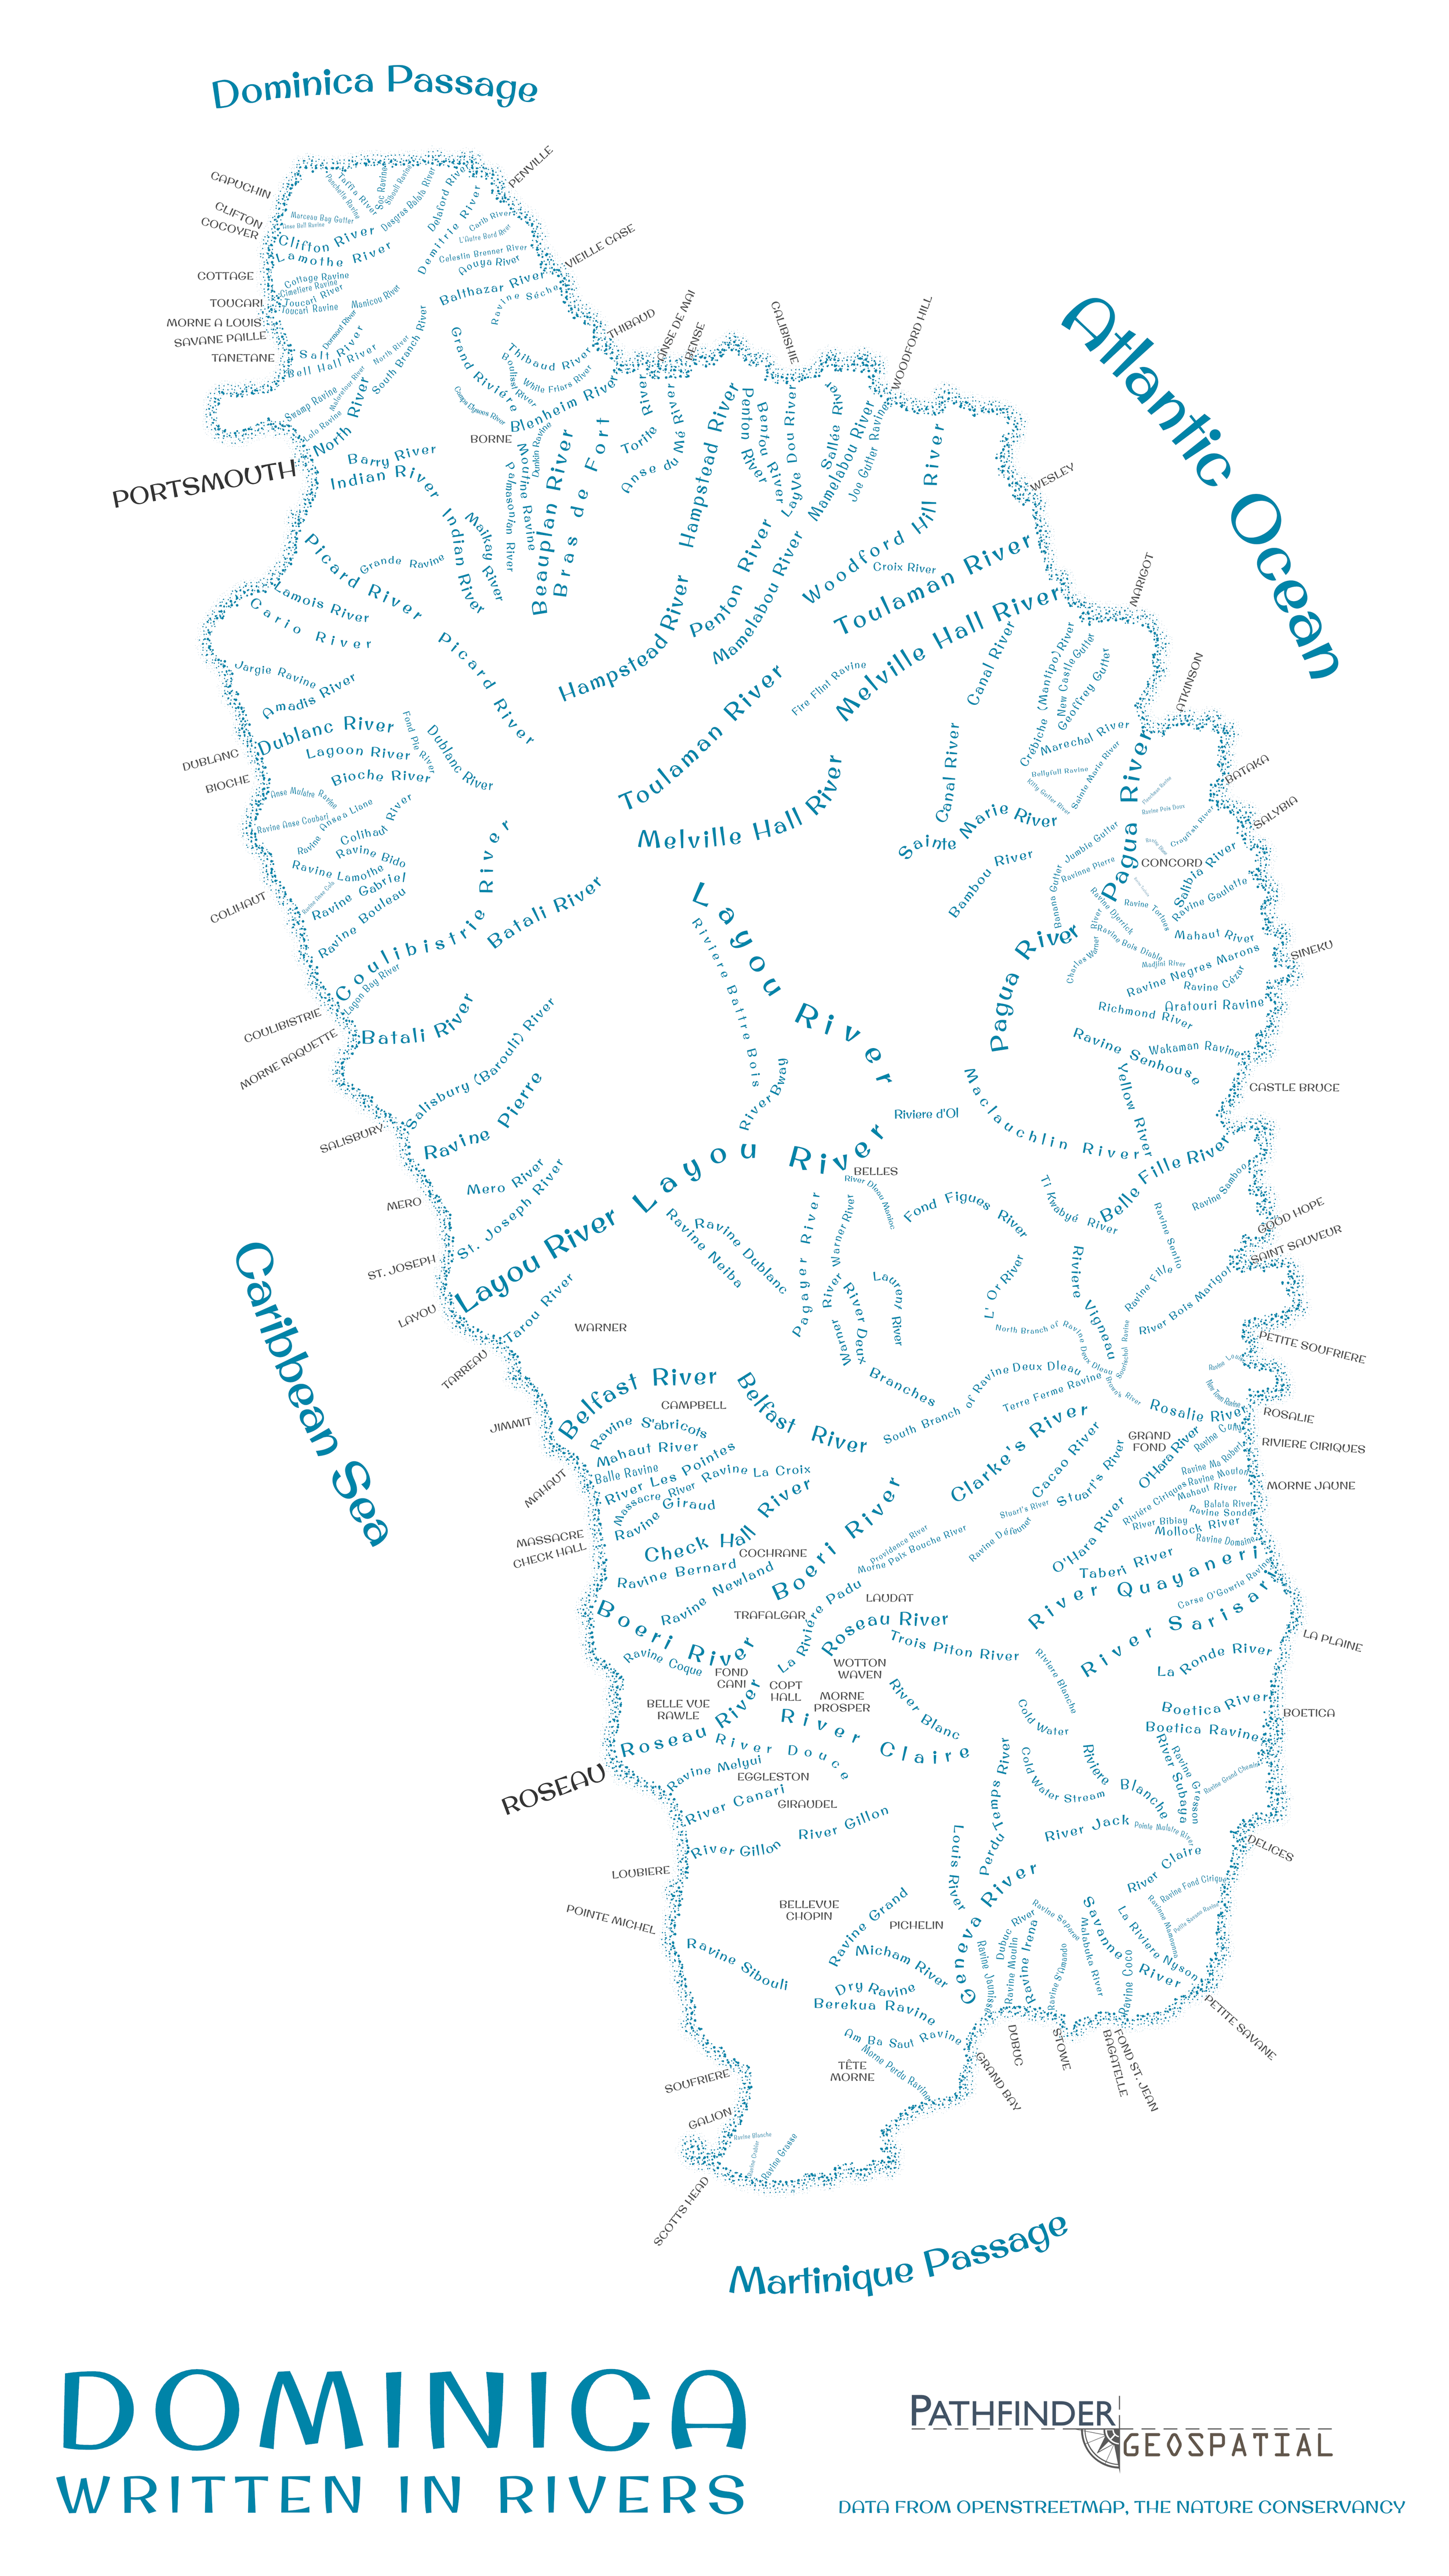
Dominica: Written in Rivers
An artistic take on mapping the Nature Island of the Caribbean.
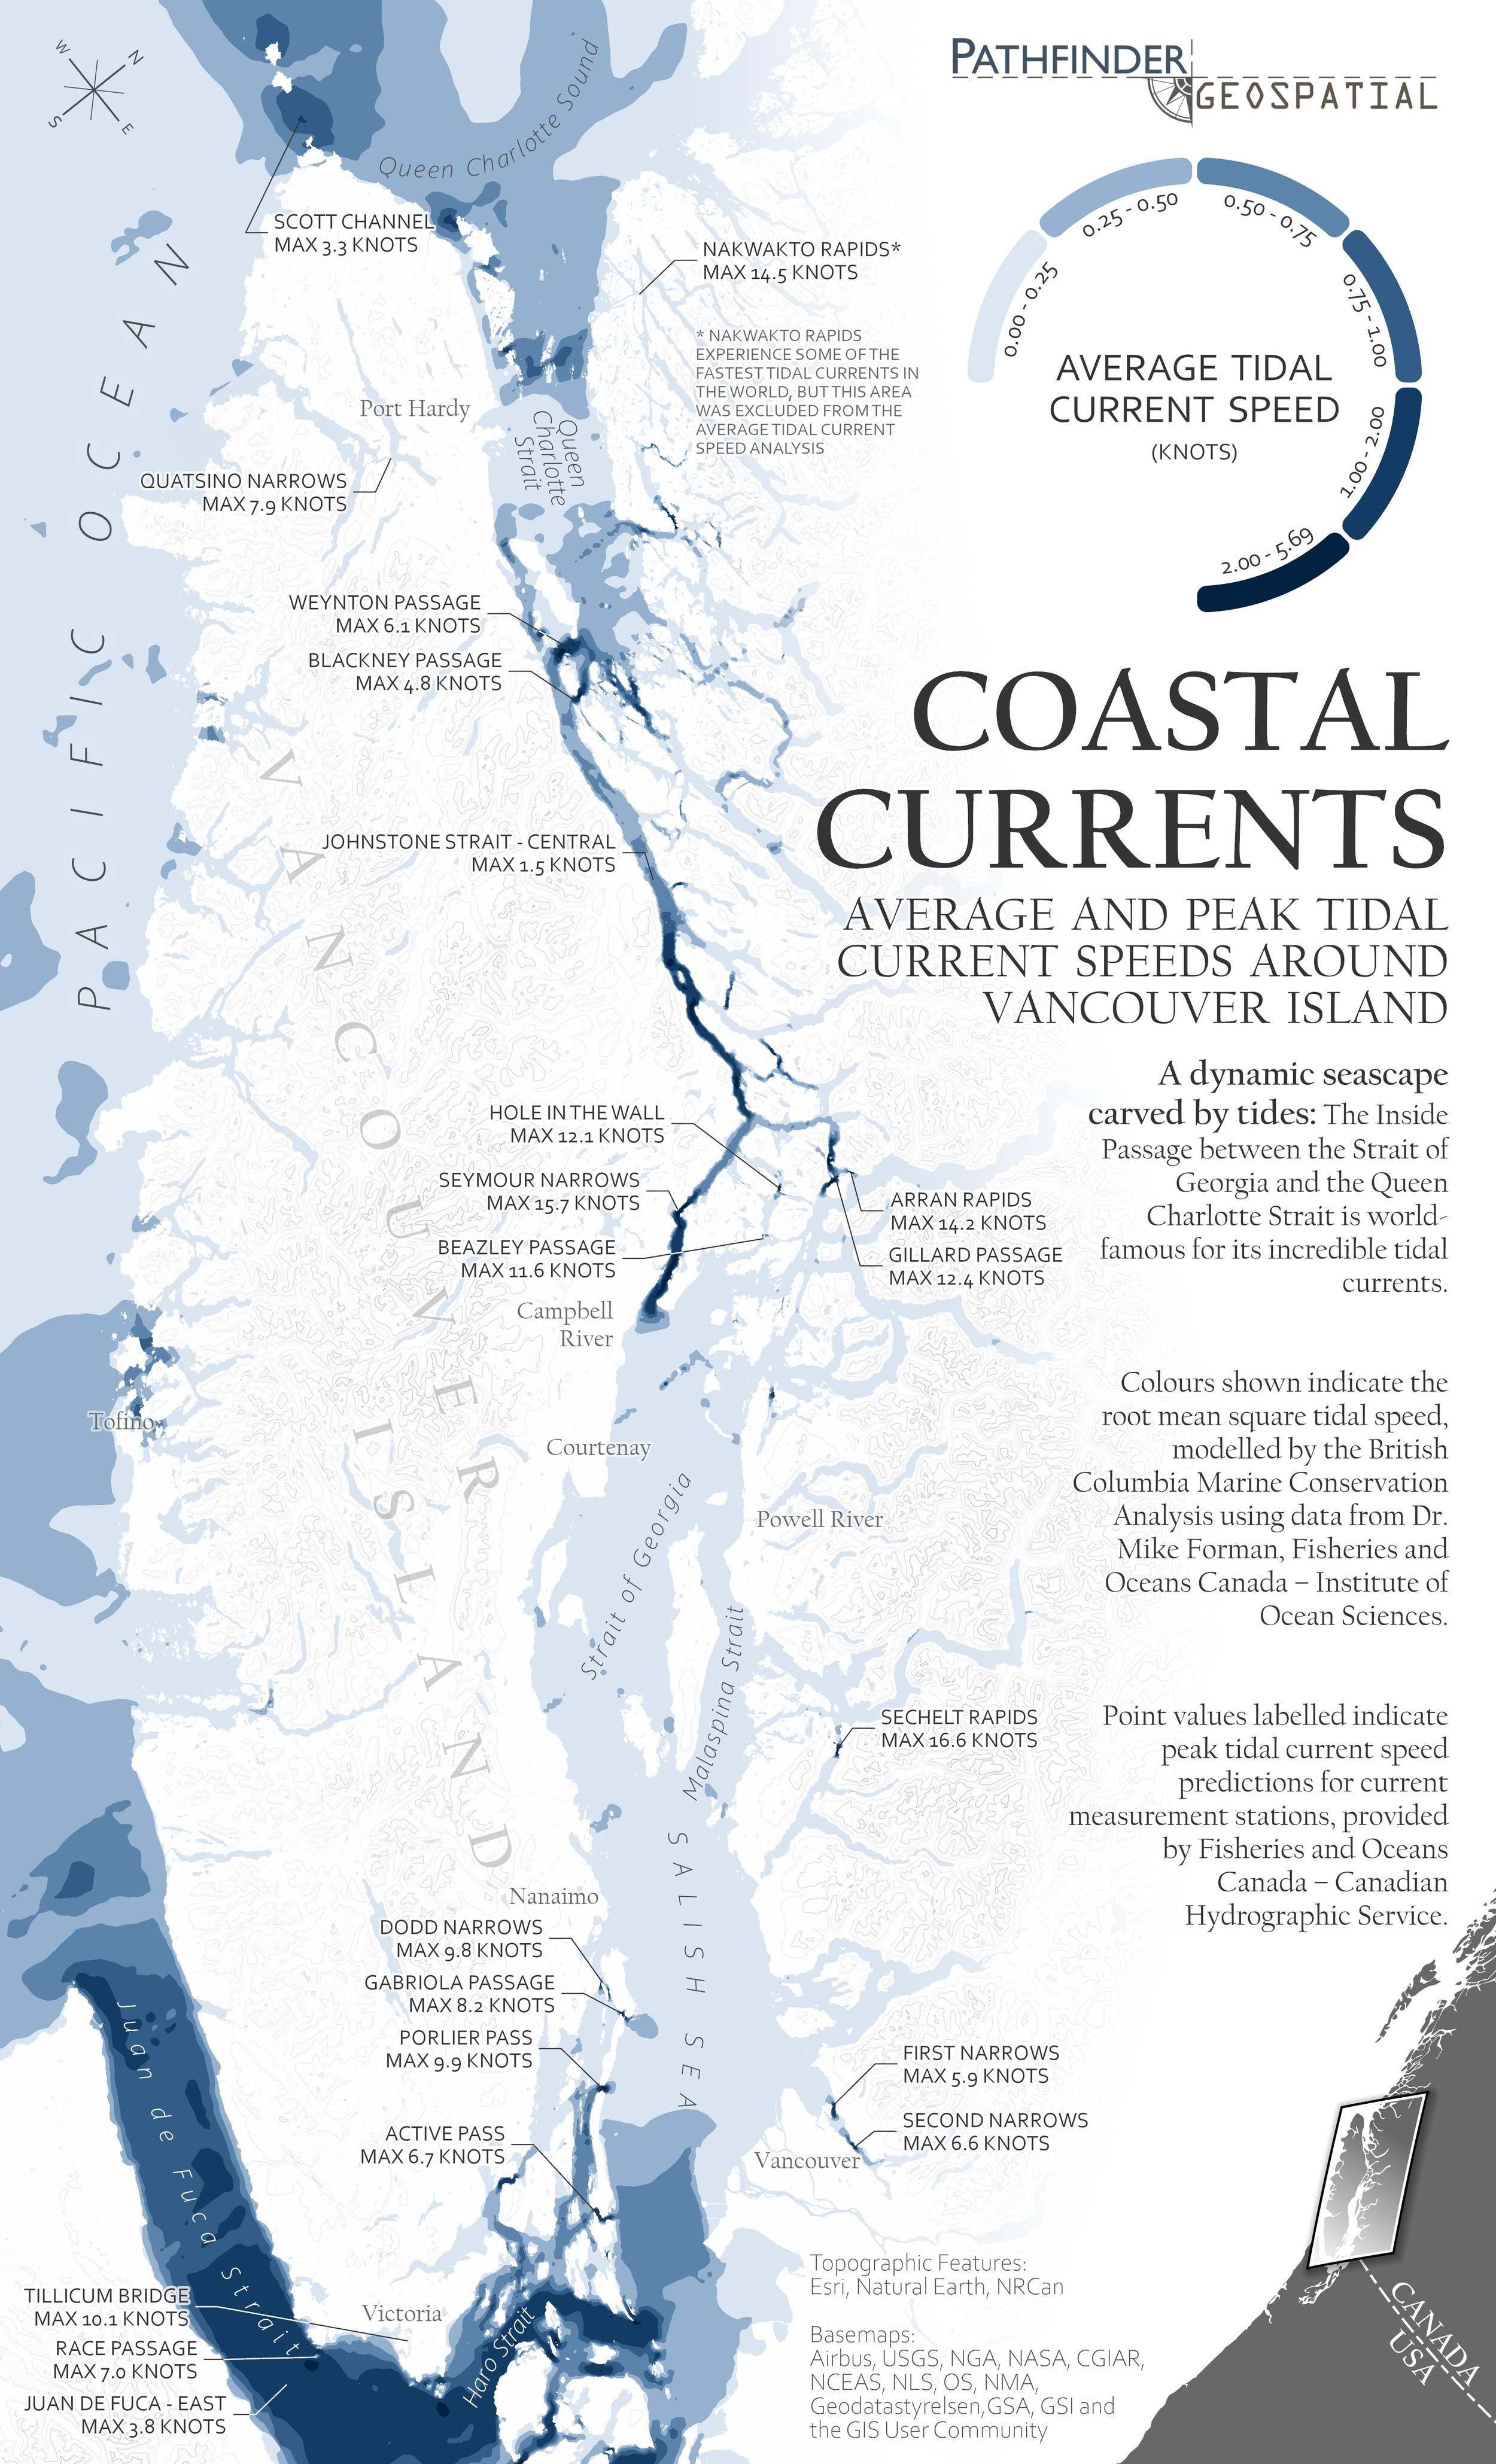
Coastal Currents
A monochromatic map showing average and peak tidal current speeds around Vancouver Island, BC, Canada.

Of Clouds and Crowns
A bivariate map that compares and contrasts annual rainfall amounts with average tree canopy heights in a region known for both.
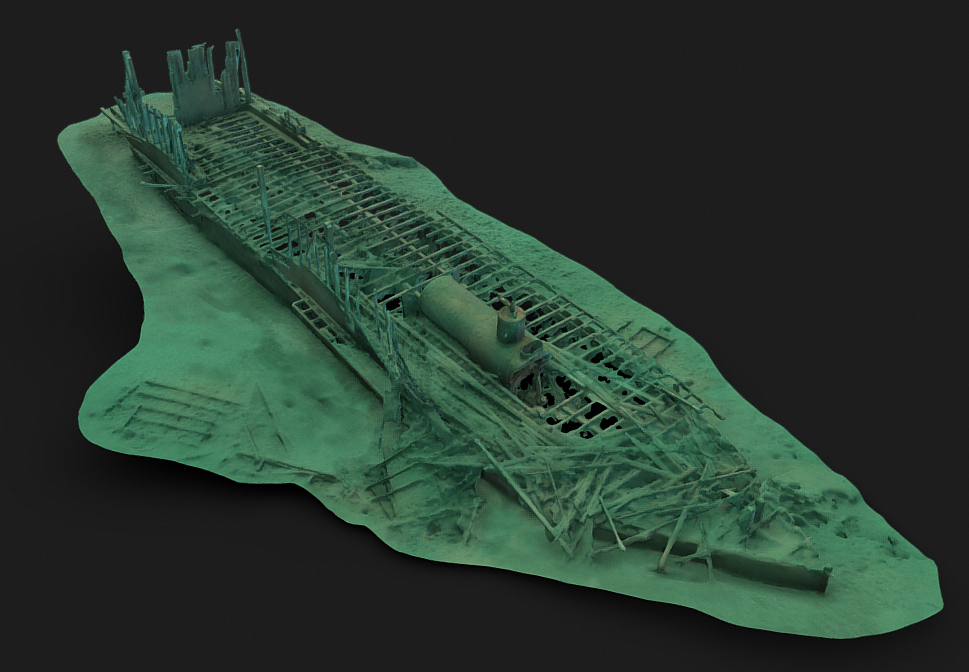
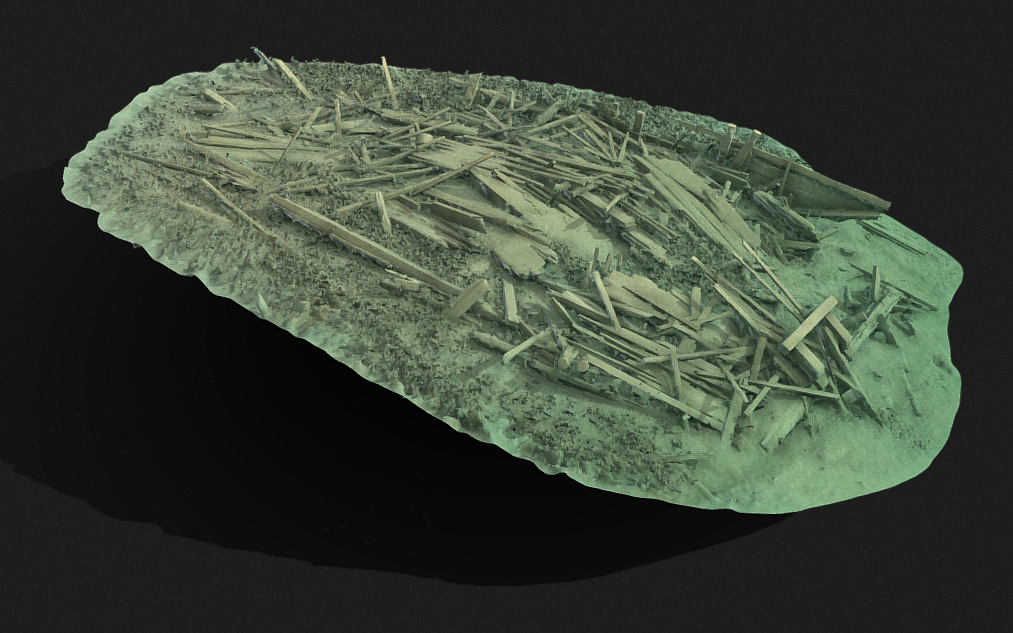
The Gertrude Wreck
A 3D model of a steam-powered stern paddle-wheeler built in the early 1900s that operated in Waterton Lakes National Park.

How Long is Longitude?
An infographic designed to help understand how the length of a degree of longitude changes with latitude.

Sunken Car
A 3D model of a very poorly-parked car at the bottom of Emerald Lake, Alberta, Canada.

How Much and How Many?
A bivariate map comparing and contrasting global terrestrial biomass and species richness.

West Coast Whales
An offset map describing humpback whale sightings reported to iNaturalist.

Minnewanka Landing Stove
A 3D model of a century-old stove at the bottom of Lake Minnewanka, Alberta, Canada.

Where Noon Isn’t Noon
A thematic map describing the global differences between solar noon and “clock” noon.

The Salt of the Earth
Using data from the Copernicus Marine Service, this map examines the average surface-level ocean salinity in 2023.

Oceanic Oscillations
Created using FES2014 data from Aviso+, this map displays maximum tidal ranges (the difference between the lowest low tide and highest high tide) around the world.


Lake Minnewanka 1912 Dam
A 3D model of a flooded hydroelectric dam in Lake Minnewanka, Alberta, Canada.

Sable Island
A retouched presentation of a map describing known shipwrecks around Sable Island, Nova Scotia, Canada since 1583.